9 October 2026

the model
For a sample s (a unique combination of site visit, species and lifestage) fished with n_s passes, let y_{si} be the number of fish caught on pass i and p_{si} the capture probability on that pass. The probability that a fish is first caught on pass i is
\pi_{si} = p_{si} \prod_{j < i} (1 - p_{sj})
Conditional on the total catch, T_s = \sum_i y_{si}, the counts are multinomial with probabilities \pi_{si} / P_s, where P_s = \sum_i \pi_{si} is the cumulative capture probability. This gives the log likelihood
\ell = \sum_s \left( \sum_i y_{si} \log \pi_{si} - T_s \log P_s \right)
which does not depend on the unknown number of fish at the site. Capture probability is modelled on the logit scale
\text{logit}(p_{si}) = \mathbf{x}_{si}^\top \boldsymbol{\beta} + \mathbf{z}_{si}^\top \mathbf{b}, \qquad b_k \sim N(0, \sigma_{g(k)}^2)
where \boldsymbol{\beta} are fixed effects and \mathbf{b} are optional random effects, for example for visit and sample, with one standard deviation \sigma_g for each random effect term. The random effects are integrated out of the likelihood using the Laplace approximation, and the fixed effects and standard deviations are estimated by maximum likelihood using RTMB.
Fish density is then estimated by dividing the total catch by the area fished and the cumulative capture probability: T_s / (A_s P_s).
installation
To install the ef package from r-universe run
install.packages("ef2", repos = c('https://faskally.r-universe.dev', 'https://cloud.r-project.org'))or to install the latest development version from GitHub run
remotes::install_github("faskally/ef2")Create Required Fields for Analysis
Create a factor for pass with separate levels for the first and subsequent passes. NOTE: Assuming the second and third pass have the same capture probability avoids problems with model identifiability (Millar et al., 2016)
Create a sampleID for grouping EF counts together. A sample is a unique combination of site visit x species x lifestage and is required by the EF function
ef2_data$sampleID <-
  as.numeric(
    factor(
      paste(ef2_data$date, ef2_data$siteID, ef2_data$lifestage, ef2_data$species)
    )
  )
Create a visitID for unique site visits. This is used to include between visit variation as a random effect (see below).
Create a factor for year
ef2_data$fyear <- factor(ef2_data$year)Fit a Model
Fit a simple model. This contains a factor for pass (2 levels), lifestage (2 levels), site (3 levels) and year (5 levels). Continuous variables can be added as linear or smooth terms, see below and Millar et al., 2016 for further details.
m1 <-
  efp2(
    count ~ siteID + fyear + pass12 + lifestage,
    data = ef2_data, pass = pass, id = sampleID
  )
##
## Call:
## efp2(formula = count ~ siteID + fyear + pass12 + lifestage, data = ef2_data,
## pass = pass, id = sampleID)
##
## Formula:
## count ~ siteID + fyear + pass12 + lifestage
##
## No random effects
##
## Coefficients:
## Estimate Std. Error z value Pr(>|z^2|)
## (Intercept) 0.65231 0.1723 3.78665 1.527e-04
## siteIDSite2 0.07453 0.1354 0.55053 5.820e-01
## siteIDSite3 -0.02373 0.1473 -0.16106 8.720e-01
## fyear2012 -0.20996 0.1736 -1.20943 2.265e-01
## fyear2013 0.04698 0.1855 0.25318 8.001e-01
## fyear2014 0.35844 0.1834 1.95392 5.071e-02
## fyear2015 -0.00402 0.2114 -0.01902 9.848e-01
## pass122 -0.23915 0.1311 -1.82432 6.810e-02
## lifestageParr 0.59065 0.1210 4.88215 1.049e-06
##
## Degrees of Freedom: 90 Total (i.e. Null); 81 Residual
## AIC: 3188Smooth Terms
Smooth terms are penalised, and the amount of smoothing is estimated. A smooth is fitted as a random effect: the part of the smooth that is not penalised is a fixed effect, and the standard deviation of the random part controls how smooth the term is.
The recommended smooths are first and second order random walks. These use the Markov random field (mrf) basis from mgcv with a penalty created by rw_penalty(). Both the basis and the penalty are sparse, so these models are quick to fit even when the walk has many steps.
- a first order random walk (
order = 1) penalises the differences between neighbouring levels and shrinks towards a constant - a second order random walk (
order = 2) penalises the second differences and shrinks towards a linear trend
The covariate must be a factor whose levels are the steps of the walk, in order. Here the year factor is replaced by a first order random walk over years.
rw1 <- rw_penalty(levels(ef2_data$fyear), order = 1)

m1_smooth <-
  efp2(
    count ~ siteID + s(fyear, bs = "mrf", xt = list(penalty = rw1)) +
      pass12 + lifestage,
    data = ef2_data, pass = pass, id = sampleID
  )
##
## Call:
## efp2(formula = count ~ siteID + s(fyear, bs = "mrf", xt = list(penalty = rw1)) +
## pass12 + lifestage, data = ef2_data, pass = pass, id = sampleID)
##
## Formula:
## count ~ siteID + s(fyear, bs = "mrf", xt = list(penalty = rw1)) +
## pass12 + lifestage
##
## Random effects:
## Estimate Std. Error
## sigma s(fyear) 0.192 0.1239
##
## Coefficients:
## Estimate Std. Error z value Pr(>|z^2|)
## (Intercept) 0.59940 0.1565 3.8304 1.279e-04
## siteIDSite2 0.08303 0.1345 0.6172 5.371e-01
## siteIDSite3 -0.02424 0.1466 -0.1653 8.687e-01
## pass122 -0.24364 0.1309 -1.8614 6.269e-02
## lifestageParr 0.59448 0.1160 5.1239 2.993e-07
##
## Degrees of Freedom: 90 Total (i.e. Null); 84 Residual
## AIC: 3193The standard deviation, sigma s(fyear), is that of the steps of the random walk on the logit scale. The starting value of the walk is a fixed effect, so the intercept is for the first year.
The smooth effect of year on capture probability, here for the first pass for fry at Site1, with approximate 95% confidence intervals
newdata <-
  data.frame(
    siteID = "Site1", pass12 = "1", lifestage = "Fry",
    fyear = factor(levels(ef2_data$fyear), levels = levels(ef2_data$fyear))
  )
pred <- predict(m1_smooth, newdata = newdata, se.fit = TRUE)
year <- as.numeric(levels(ef2_data$fyear))

plot(year, plogis(pred$fit), type = "b", pch = 16, ylim = c(0, 1),
     xlab = "Year", ylab = "Capture probability")
lines(year, plogis(pred$fit - 2 * pred$se.fit), lty = 2)
lines(year, plogis(pred$fit + 2 * pred$se.fit), lty = 2)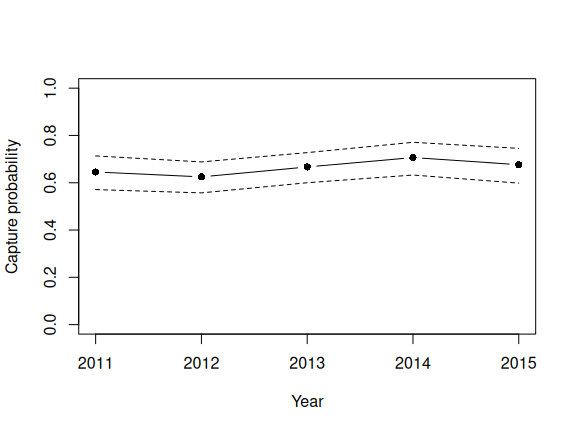
The models with a year factor and a random walk over years can be compared using AIC
AIC(m1, m1_smooth)A random walk can have steps with no data, for example a walk over every day of the year when sites were only fished on some of them. All the steps are included in the penalty, and the factor is given the same levels. Here a second order random walk is used for day of the year (doy).
days <- min(ef2_data$doy):max(ef2_data$doy)
ef2_data$fdoy <- factor(ef2_data$doy, levels = days)
rw2 <- rw_penalty(days, order = 2)

m1_doy <-
  efp2(
    count ~ siteID + s(fdoy, bs = "mrf", xt = list(penalty = rw2)) +
      pass12 + lifestage,
    data = ef2_data, pass = pass, id = sampleID
  )
##
## Call:
## efp2(formula = count ~ siteID + s(fdoy, bs = "mrf", xt = list(penalty = rw2)) +
## pass12 + lifestage, data = ef2_data, pass = pass, id = sampleID)
##
## Formula:
## count ~ siteID + s(fdoy, bs = "mrf", xt = list(penalty = rw2)) +
## pass12 + lifestage
##
## Random effects:
## Estimate Std. Error
## sigma s(fdoy) 1.381e-06 0.001964
##
## Coefficients:
## Estimate Std. Error z value Pr(>|z^2|)
## (Intercept) 0.678310 0.1178 5.75868 8.478e-09
## siteIDSite2 0.001894 0.1448 0.01309 9.896e-01
## siteIDSite3 -0.158752 0.1653 -0.96067 3.367e-01
## pass122 -0.254288 0.1308 -1.94348 5.196e-02
## lifestageParr 0.607910 0.1135 5.35678 8.472e-08
## s(fdoy).null1 -0.550221 0.3837 -1.43400 1.516e-01
##
## Degrees of Freedom: 90 Total (i.e. Null); 83 Residual
## AIC: 3196In this case the standard deviation is very close to zero, so the smooth has been shrunk to its unpenalised part, a linear trend in day of the year (the fixed effect s(fdoy).null1).
newdata <-
  data.frame(
    siteID = "Site1", pass12 = "1", lifestage = "Fry",
    fdoy = factor(days, levels = days)
  )
pred <- predict(m1_doy, newdata = newdata, se.fit = TRUE)

plot(days, plogis(pred$fit), type = "l", ylim = c(0, 1),
     xlab = "Day of year", ylab = "Capture probability")
lines(days, plogis(pred$fit - 2 * pred$se.fit), lty = 2)
lines(days, plogis(pred$fit + 2 * pred$se.fit), lty = 2)
rug(ef2_data$doy)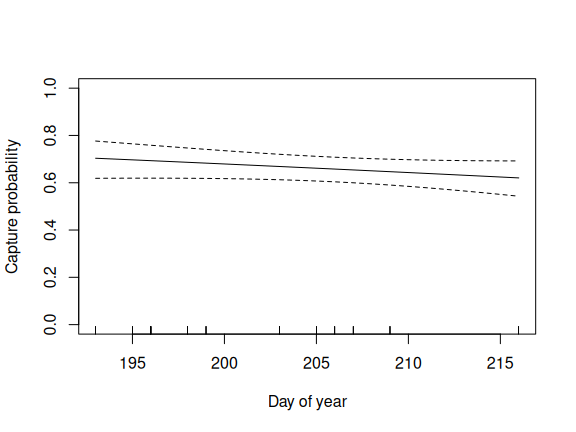
Any other penalised smooth from mgcv can be used, for example s(doy) or te(doy, area), but their penalties are not sparse so they take longer to fit. An unpenalised regression spline, whose flexibility is set by its basis dimension k, can be fitted using fx = TRUE, for example s(doy, k = 3, fx = TRUE).
Get Predicted Values for P
Predict P from the model to the full dataset. Note, if all the data is multi-pass then can just use fitted values. However, if you want P for both single and multi-pass data then predict to the new dataframe
ef2_data$prob <- predict(m1, newdata = ef2_data, type = "response")Standard errors of the predictions are available using se.fit = TRUE. To use the plotting and prediction tools in mgcv the model can also be converted to a gam object using as.gam2(m1).
Cumulative Capture Probability and Abundance
The cumulative capture probability of a sample, P, is the probability that a fish is caught on one of the passes. It is estimated for each sample, with standard errors and confidence intervals, using
cp <- capture_prob(m1, se.fit = TRUE)
head(cp)
## id npass P se lower upper
## 1 2 3 0.9838939 0.4557355 0.9615466 0.9933439
## 2 1 3 0.9457095 0.3923452 0.8897905 0.9740823
## 3 29 3 0.9210062 0.3264868 0.8601089 0.9567274
## 4 30 3 0.9745545 0.4222702 0.9436305 0.9887166
## 5 16 3 0.9855114 0.3968673 0.9689903 0.9932915
## 6 15 3 0.9502933 0.3846208 0.8999607 0.9759781The standard errors are of \text{logit}(P), and the confidence intervals are computed on the logit scale. newdata can be used to estimate P for other samples, for example single pass samples (Glover et al., 2018).
Abundance is estimated as \hat N = T / P, and density (fish m-2) as \hat N / A, where A is the area fished. The confidence intervals allow for both the binomial variation in the catch and the uncertainty in P
##   id catch         P         N       se    lower     upper area   density
## 1  2    42 0.9838939  42.68753 0.892726  42.0000  44.47359  122 0.3498978
## 2  1    49 0.9457095  51.81295 2.047553  49.0000  55.98559  122 0.4246963
## 3 29   140 0.9210062 152.00766 5.329788 141.9123 162.82116  122 1.2459644
## 4 30    41 0.9745545  42.07050 1.141402  41.0000  44.36816  122 0.3448402
## 5 16    86 0.9855114  87.26434 1.238831  86.0000  89.72650  122 0.7152815
## 6 15    50 0.9502933  52.61533 1.940101  50.0000  56.55864  122 0.4312732
##   density_lower density_upper
## 1     0.3442623     0.3645377
## 2     0.4016393     0.4588983
## 3     1.1632158     1.3345996
## 4     0.3360656     0.3636734
## 5     0.7049180     0.7354631
## 6     0.4098361     0.4635954
Abundance can be summed over samples using by, for example over the fry and parr at each site in each year, or over all the sites in each year. The confidence intervals allow for the correlation between the estimates of P, which depend on the same model coefficients
##   siteID year nsample catch         N       se    lower     upper area
## 1  Site1 2011       2    91  94.50048 2.356786  91.0000  99.23445  122
## 2  Site1 2012       2   181 194.07817 5.702209 183.2177 205.58235  122
## 3  Site1 2013       2   136 139.87967 2.468399 136.0000 144.80228  122
## 4  Site1 2014       2   119 121.34350 1.798448 119.0000 124.92009  122
## 5  Site1 2015       2    98 101.89283 2.600999  98.0000 107.12037  124
## 6  Site2 2011       2   157 162.12955 3.031428 157.0000 168.18125  264
##     density density_lower density_upper
## 1 0.7745941     0.7459016     0.8133972
## 2 1.5908046     1.5017848     1.6851012
## 3 1.1465547     1.1147541     1.1869040
## 4 0.9946188     0.9754098     1.0239351
## 5 0.8217164     0.7903226     0.8638740
## 6 0.6141271     0.5946970     0.6370502
abundance(m1, by = "year")## year nsample catch N se lower upper
## 1 2011 6 355 368.0506 5.889016 356.6874 379.7757
## 2 2012 6 688 734.4195 14.606285 706.3425 763.6125
## 3 2013 6 473 482.8034 4.484568 474.0934 491.6735
## 4 2014 6 493 501.3551 4.028927 493.5204 509.3141
## 5 2015 6 273 280.4354 4.017294 273.0000 288.4207To model counts directly, for example with a Poisson model, the offset is \log(A P)
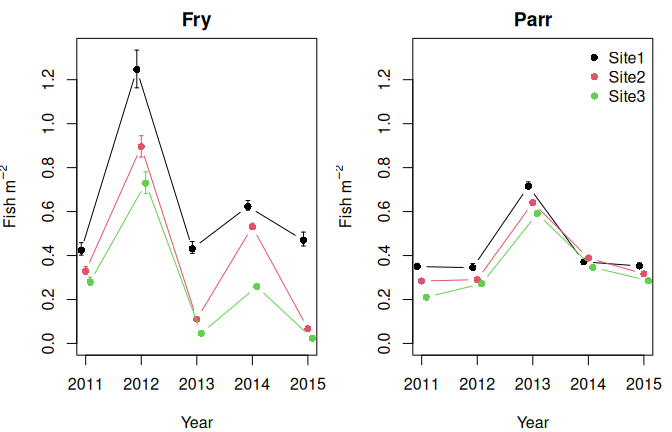
dens$offset <- log(dens$area * dens$P)Plot to check
Comparing Models
Electrofishing count data are typically overdispersed: capture probability varies between visits to a site, and between samples within a visit, by more than the covariates can explain. This variation is included in the model using random effects, which are specified by adding s(f, bs = "re") terms to the formula, where f is a factor.
The sampleID needs to be a factor to be used as a random effect
ef2_data$fsampleID <- factor(ef2_data$sampleID)Fit a model with visit and sample random effects
mfull <- efp2(count ~ siteID + year + lifestage + pass12 +
               s(visitID, bs = "re") + s(fsampleID, bs = "re"),
             data = ef2_data, pass = pass, id = sampleID)

mfull
##
## Call:
## efp2(formula = count ~ siteID + year + lifestage + pass12 + s(visitID,
## bs = "re") + s(fsampleID, bs = "re"), data = ef2_data, pass = pass,
## id = sampleID)
##
## Formula:
## count ~ siteID + year + lifestage + pass12 + s(visitID, bs = "re") +
## s(fsampleID, bs = "re")
##
## Random effects:
## Estimate Std. Error
## sigma s(visitID) 5.965e-05 0.06556
## sigma s(fsampleID) 7.591e-02 0.17106
##
## Coefficients:
## Estimate Std. Error z value Pr(>|z^2|)
## (Intercept) 0.648110 0.1775 3.65176 2.605e-04
## siteIDSite2 0.079488 0.1418 0.56064 5.750e-01
## siteIDSite3 -0.016539 0.1553 -0.10648 9.152e-01
## year2012 -0.208321 0.1793 -1.16174 2.453e-01
## year2013 0.042289 0.1926 0.21953 8.262e-01
## year2014 0.362184 0.1895 1.91137 5.596e-02
## year2015 -0.002674 0.2168 -0.01234 9.902e-01
## lifestageParr 0.588609 0.1251 4.70513 2.537e-06
## pass122 -0.235586 0.1318 -1.78694 7.395e-02
##
## Degrees of Freedom: 90 Total (i.e. Null); 79 Residual
## AIC: 3192The estimated standard deviations of the visit and sample random effects (on the logit scale) are
mfull$sigmaBecause the random effects are part of the likelihood, models can be compared directly using AIC
- Full model
AIC(mfull)- Model without lifestage